


View Model. Example
In this article we will go through the steps of creating a simple game screen. We will make it the traditional way without using View Model and we will see why it is absolutely wrong to persist data in the View.
MVVM’s Model implementation in Android application. Room
As we said in the previous article Model is the data in our application. These are classes representing objects that we persist in our database or that we get from network calls to services.

Using Room in CryptoOracle
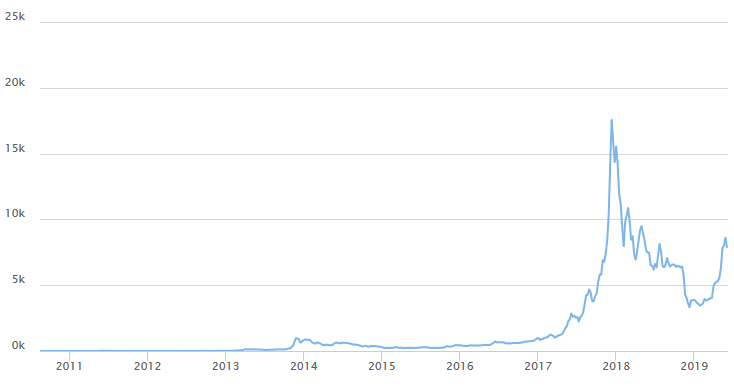
In the Android application CryptoOracle the data is persisted in SQLite database. The reasons are two:
The application can still work and show persisted data when there is no internet connection.